

How to evaluate AI visibility tool accuracy without being misled by a polished dashboard starts with a controlled test. Do not ask which platform has the most attractive score. Ask whether its findings are reproducible, supported by inspectable evidence and useful enough to guide a safe change. With a fixed website sample and prompt set, you can compare tools on what they observed—not on how they package the result.
Before you begin, prepare access to your site, analytics or server logs where available, and a small set of representative URLs. You also need a list of realistic prompts your customers might ask an AI search experience. The process below works whether you are selecting a platform, auditing an agency’s report or checking the accuracy of a tool already in your workflow.
Quick answer: An accurate AI visibility tool should show its inputs, preserve raw evidence, produce reasonably repeatable observations and distinguish crawler access, rendering, content quality, mentions and citations. Test several tools with the same URLs, prompts, platforms, regions and dates. Then verify a sample of findings manually before trusting any summary score.
What evaluating AI visibility tool accuracy means in practical terms
Accuracy is not the same as agreement. Two tools may calculate different headline scores because they use different prompt sets, AI surfaces, sampling windows or weighting formulas. That does not automatically make either result wrong. The useful question is whether each platform describes its measurement clearly and whether you can trace a score back to observable facts.
Define the claim you are testing. A crawl-access tool should correctly identify whether selected URLs can be requested. A rendering check should show what content is available after processing. A visibility tracker should preserve the prompt, response, model or surface, collection date, detected brand mention and cited URL. A reliable product should not compress these separate stages into one unexplained number.
Accuracy is not agreement: identical scores from two tools can still be wrong, while different scores can both be valid if they measure different things. Judge the chain from input to evidence to conclusion.
Step 1 — Establish a clean baseline and choose representative URLs
Start with a baseline that another evaluator could reproduce. Select roughly eight to twelve URLs that represent the real site: the homepage, a product or service page, a topic hub, a detailed article, a conversion page, a recently published page and at least one page that relies heavily on JavaScript. Include a known healthy URL and, if possible, a controlled test URL with a documented issue.
Record each URL’s expected HTTP status, canonical URL, robots directives, rendered main content and important internal links. Keep crawl access and indexing separate: a robots.txt rule manages crawler access, but it is not a universal promise that a URL will never appear in a search index. Google’s robots.txt guidance is a useful reference for understanding that distinction.
- Freeze the test date: note when every run begins and ends.
- Use the same URL list: do not let one tool choose only its easiest pages.
- Document the expected state: healthy, blocked, redirected, canonicalized or rendered incorrectly.
- Save raw outputs: screenshots alone are not enough when exports or evidence logs are available.
Step 2 — Run the same site and prompt set through each option
Create a controlled panel of 30 to 50 prompts across discovery, comparison and purchase intent. Use the exact same spelling, brand names and competitor references in every platform. Where the tool permits it, lock the AI surface, geography, language, device assumptions and collection window. If a setting cannot be matched, record it as a limitation rather than pretending the results are directly comparable.
| Test dimension | Keep constant | Save as evidence |
|---|---|---|
| Website sample | Same representative URLs | URL list and expected state |
| Prompt panel | Same wording and intent mix | Prompt, response and timestamp |
| AI surface | Same model or search experience where possible | Platform and configuration |
| Location | Same country and language | Region settings |
| Outcome rules | Same definitions for mention and citation | Detected entity and cited URL |
Compare raw findings before comparing scores. If Tool A reports 42 and Tool B reports 67, that gap has little meaning until you know their denominators. One may count mentions across a broad database, while the other reports the percentage of your custom prompts that produced a brand mention. For a deeper explanation, see why AI visibility scores differ between tools.
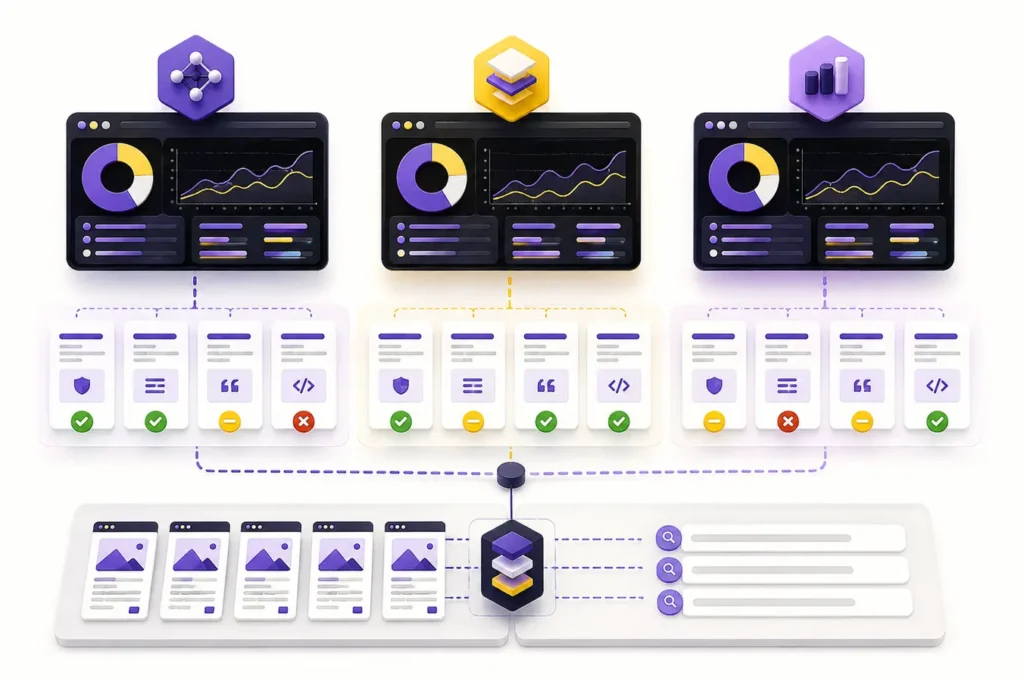
Step 3 — Inspect the evidence and separate failure types
A trustworthy diagnosis shows where the evidence chain broke. Inspect at least ten positive findings and ten negative findings manually. For technical checks, open the URL, review the returned status and inspect the content the tool says it saw. For visibility results, compare the saved response with the detected brand and cited domain.
- Access failure: the requested URL returns a block, error, challenge or unexpected redirect.
- Rendering failure: the page loads, but meaningful content or links are absent from the processed output.
- Content failure: the page is accessible, yet the answer is unclear, thin, poorly structured or not supported.
- Entity failure: the tool misses a valid brand variation or incorrectly merges separate companies.
- Citation failure: a mention is counted as a citation, the wrong domain is mapped or a redirect obscures the final URL.
- Scoring failure: a summary changes without a corresponding change in the preserved observations.
Calculate false-positive and false-negative rates for your reviewed sample. A false positive says an issue exists when manual evidence shows it does not. A false negative misses a known problem. Small samples will not produce a universal accuracy percentage, but they expose whether the platform is dependable enough for your use case.
Step 4 — Apply the smallest safe fix and document the change
Choose one finding supported by clear evidence and make the smallest change that should affect it. For example, correct an accidental crawler block on one directory, expose essential server-rendered copy, repair a canonical tag or clarify an ambiguous entity reference. Avoid redesigning the page, rewriting the article and changing server rules at the same time; multiple changes make it impossible to identify what caused the result.
Create a simple change log with the URL, original observation, suspected cause, exact edit, deployment time and expected pass condition. Keep a rollback path. If the platform recommends a risky or site-wide action without showing the affected requests or pages, treat that as a workflow weakness.
Step 5 — Retest with the same inputs and define a pass condition
Run the original URL and prompt set again after the change is live. Do not add easier pages, rewrite the prompts or switch locations during the verification run. A pass condition should be observable: the URL returns the expected status, meaningful content appears in the rendered output, the false alert disappears, or a saved response now maps the correct mention and cited page.
Repeat the same test on another day or collection cycle. AI answers can vary, so accuracy should be judged across repeated observations rather than one lucky response. Technical states such as HTTP access should be highly repeatable; generative visibility results need a wider sample and a documented tolerance.
Practical pass rule: Trust a finding when the tool exposes the evidence, a manual check confirms it and a controlled retest responds in the expected direction after one documented change.
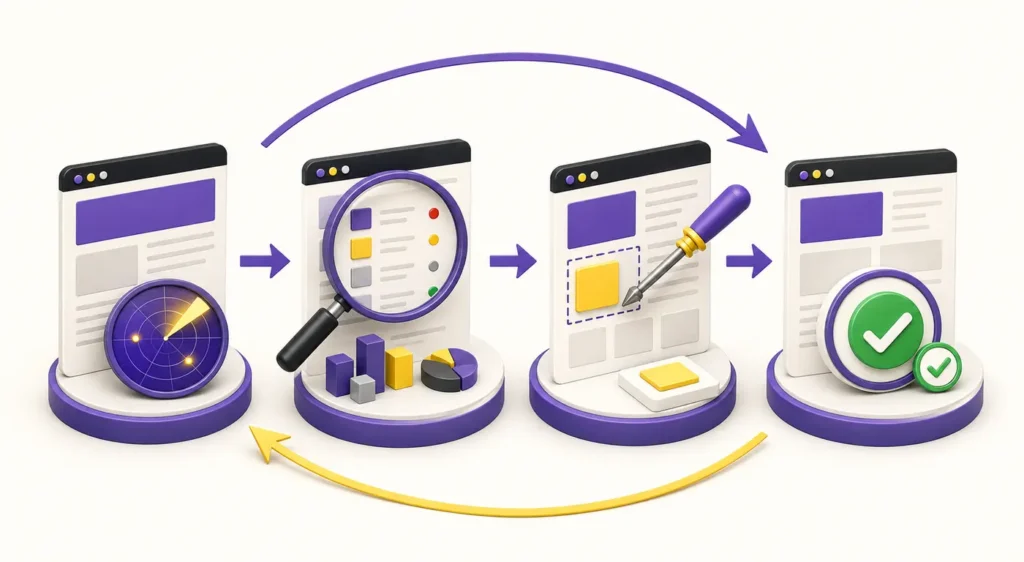
Worked example — from conflicting scores to a verified result
Imagine a B2B software company testing twelve URLs and forty commercial prompts. Tool A reports poor AI crawler access. Tool B reports adequate access but weak content quality. Instead of choosing the higher score, the team exports both tools’ URL-level evidence. Four high-value comparison pages return an intermittent 403 challenge to one verified crawler pattern, while the other eight pages load normally.
The team updates one narrow web-application firewall rule for the affected directory and leaves the content unchanged. It records the deployment time, reruns the same URLs and confirms that all twelve now return the expected response with meaningful HTML. Tool A removes the access warnings. Tool B’s content assessment does not materially change—which is reasonable, because no copy was edited.
The result does not prove that Tool A is universally more accurate. It proves that its access finding was verifiable and responsive to a controlled fix. Tool B may still be useful for content review, but its higher overall score did not reveal the technical failure. This is why capability-level accuracy matters more than a single ranking.
Evidence and screenshots to include in your evaluation
A defensible buying decision should include a compact evidence pack. Save the test plan, configuration, URL sample, prompt panel, raw outputs, manual review notes, change log and retest. Add screenshots for context, but retain machine-readable exports where possible. This lets another team member audit the decision after a dashboard or model changes.
| Evaluation area | Strong signal | Warning sign |
|---|---|---|
| Coverage | Relevant URLs, prompts and AI surfaces are disclosed | Large score with an unknown sample |
| Repeatability | Stable settings and timestamps | Results cannot be recreated |
| Raw evidence | Responses, statuses and cited URLs are inspectable | Only a proprietary score is shown |
| Scoring logic | Definitions and weighting are explained | Unexplained changes in totals |
| False positives | Sample findings survive manual review | Generic advice appears for healthy pages |
| Workflow fit | Exports, history and permissions support the team | Important evidence is trapped in screenshots |
| Total cost | Price is tied to usable coverage and decisions | Cost grows with noisy checks or redundant seats |
Common interpretation mistake
Do not choose by dashboard polish or one proprietary score. A visually impressive report can still hide a weak sample, mismatched prompt set or incorrect diagnosis. Start with evidence quality, then assess workflow, coverage and price. A useful tool should help you reach a correct decision—not merely produce more charts.
Also avoid treating every AI mention change as the direct result of your latest edit. Models, retrieval systems, source indexes and competing content change over time. Use control prompts, repeated runs and dated evidence. If several products disagree, follow the underlying URLs and responses before escalating to a broad website change.
How to evaluate AI visibility tool accuracy before you buy
Run a short proof of concept using the same evaluation sheet for every vendor. Score each product separately for access diagnostics, rendering evidence, prompt tracking, entity matching, citation mapping, exports, repeatability and support. Weight the categories according to your actual workflow: an agency may value multi-client reporting and permissions, while a small business may prioritize clear fixes and low ongoing effort.
Then compare your results with the AI visibility tool accuracy benchmark and the broader guide to choosing an AI visibility audit solution. External benchmarks can reveal patterns, but your controlled test determines whether a product is accurate for your site, market and decision process.
Frequently asked questions
Can an AI visibility tool guarantee accurate results?
No tool can guarantee that every generative response will be identical or that every future citation will be predicted. A credible tool should define uncertainty, preserve observations and make technical checks reproducible.
How many prompts are enough for an accuracy test?
For an initial comparison, 30 to 50 carefully selected prompts can reveal major differences in setup, entity matching and evidence quality. Expand the panel when you need stronger trend analysis across products, regions or customer segments.
Should I compare AI visibility scores directly?
Only after confirming that the tools use comparable prompts, surfaces, locations, time windows and definitions. Otherwise compare prompt-level observations, mention rates and cited URLs separately.
What is the fastest way to detect false positives?
Review a balanced sample of alerts and healthy results manually. Check the exact URL, response, rendered content and cited source, then record whether the tool’s conclusion matches the evidence.
How often should I retest a tool’s accuracy?
Retest after major product or model changes and at a regular quarterly cadence. Run an additional check when results shift sharply without a corresponding site change.
Next step — build an evidence-first evaluation
Use the AI Search Readiness checklist
Start with a fixed baseline, verify a sample of findings and retest one controlled change. The checklist helps you separate crawler access, rendering, content clarity, entity signals and citation evidence before you choose a tool or approve a site-wide fix.