

The AI search visibility benchmark by industry is not one universal score. Current evidence shows that visibility changes by platform, market, prompt set and sector. In a July 2026 benchmark covering six AI surfaces and ten consumer verticals, cross-platform agreement ranged from 51.9% for B2B SaaS to 21.9% for consumer tech. The useful benchmark is therefore a set of comparable readings—not a single percentage that claims to represent every AI answer.
Benchmark at a glance: Among 1,198 brand recommendations recorded by SearchIntel, 46.1% appeared on only one of six platforms and just 5.3% appeared on all six. Treat ChatGPT, Claude, Gemini, Perplexity, Google AI Overviews and Google AI Mode as distinct discovery markets.
What this AI search visibility benchmark by industry measures
This review was updated on 6 August 2026. It combines three different evidence lenses: recommendation and citation behavior across AI platforms, AI referral traffic across industries, and the prevalence of Google AI Overviews by category. These datasets should not be merged into a proprietary “visibility score” because each measures a different event.
| Benchmark lens | Unit measured | Best question it answers | Important limitation |
|---|---|---|---|
| Cross-platform recommendations | Brand names and citations in fixed AI answers | Do AI platforms recommend the same brands? | UK prompts and a defined question set; not market share |
| AI referral traffic | Visits attributed to AI tools | Is AI sending measurable website traffic? | A visit is not the same as a mention or citation |
| Google AI Overview saturation | Keywords displaying an AI Overview | How exposed is a category to AI summaries? | Google-only; does not measure brand inclusion |
Data integrity note: Visible Pilot did not collect the external benchmark samples below. Every percentage is attributed to its published source. The practical framework later in this article explains how to build a first-party benchmark without pretending that external figures are your own.
Key findings from current industry data
- AI answers are fragmented. SearchIntel recorded 552 of 1,198 recommended brands on exactly one platform. Only 64 brands appeared across all six platforms.
- Average agreement is low. Two platforms answering the same question shared only 31.9% of named brands on average.
- Industry context changes the baseline. B2B SaaS produced 51.9% mean agreement, while consumer tech produced 21.9%.
- Retrieval depth varies sharply. In the same 100-question study, ChatGPT averaged 4.0 citations per response; Google AI Mode averaged 21.8.
- Third-party evidence dominates. Editorial, review and brand sites supplied 82.8% of 6,119 logged citations.
- AI referral traffic is growing from a small base. Semrush reported 66% growth during 2025, but AI traffic represented only 0.14% of total visits in its channel dataset.
- Growth is not uniform. AI referral traffic increased in 16 of 17 measured industries; computer software and development declined 26%.
- Google exposure differs by category. In November 2025, Semrush found AI Overviews on 25.96% of Science keywords, 17.92% of Computers & Electronics keywords and 17.29% of People & Society keywords.
AI search visibility benchmark by industry: cross-platform agreement
The following table reports mean agreement between platforms in SearchIntel’s June 2026 study. A higher percentage means the platforms named more of the same brands for the same neutral buying questions. It does not mean that every brand in that industry has higher visibility.
| Industry / vertical | Mean cross-platform agreement | How to interpret the baseline |
|---|---|---|
| B2B SaaS | 51.9% | More consensus; mature categories and strong review-site coverage |
| Food & Drink | 38.8% | Moderate consensus, but query intent can shift quickly |
| Personal Finance | 35.0% | Trust and market-specific evidence strongly shape answers |
| Travel | 31.8% | Near the overall mean; recommendations still vary by platform |
| Home & DIY | 28.6% | Less than three in ten recommended-brand sets overlap |
| Health & Fitness | 28.6% | Similar agreement, with added sensitivity to evidence quality |
| Automotive | 27.1% | Model, price and geography can fragment recommendations |
| Fashion & Retail | 25.3% | Inventory, trend and retailer evidence create churn |
| Pets | 22.7% | Low consensus; question wording can change shortlists |
| Consumer Tech | 21.9% | Lowest agreement in this sample; products and evidence move fast |
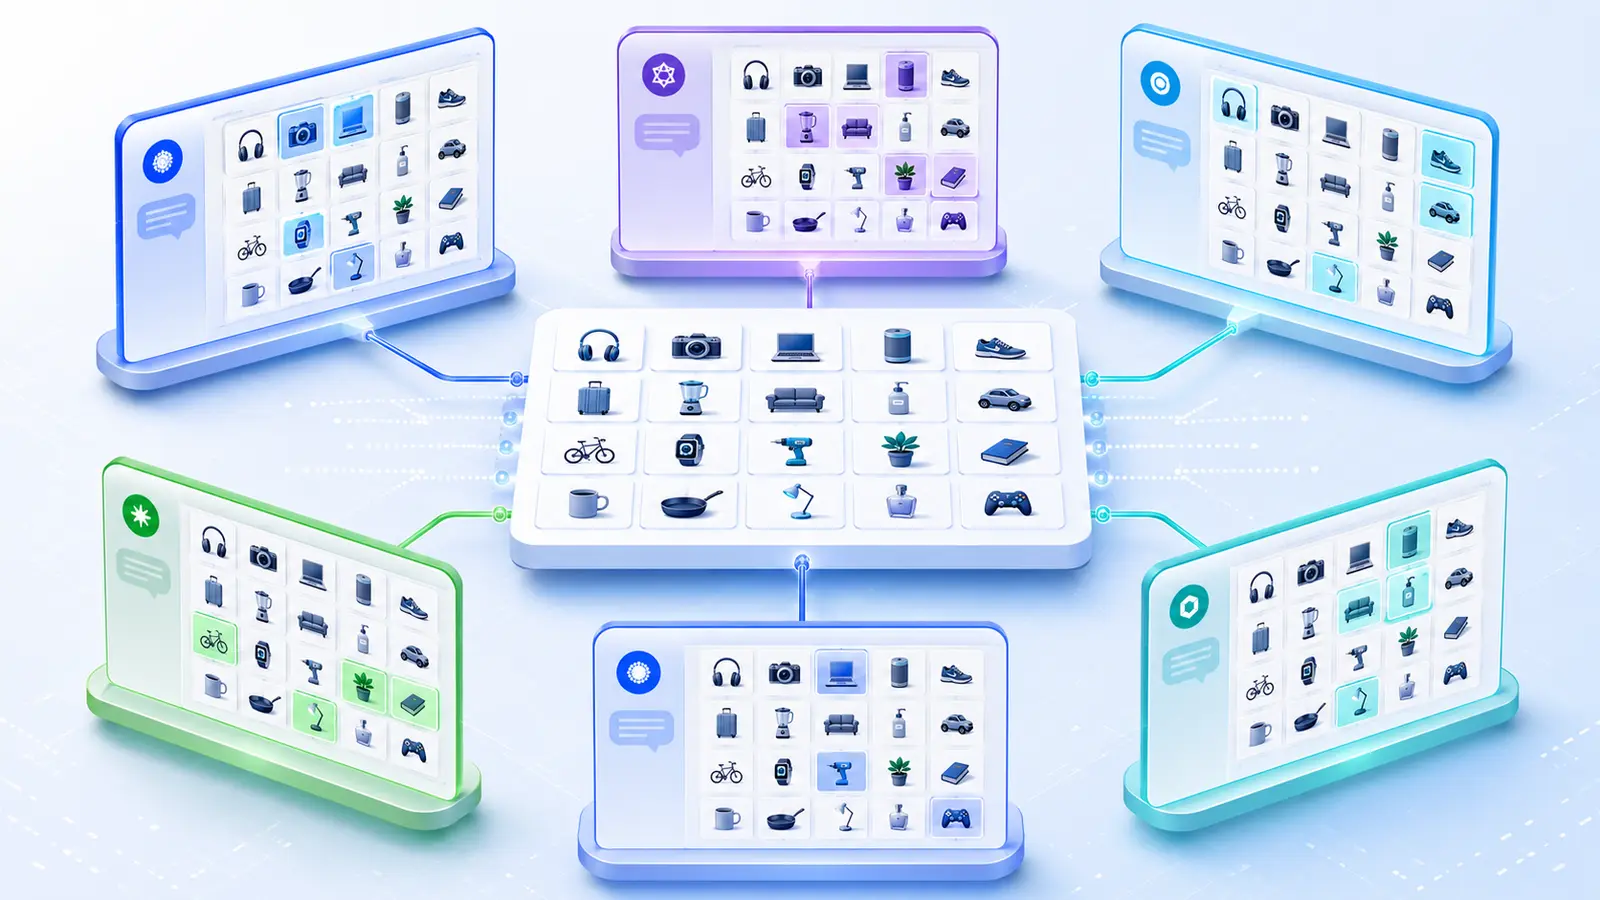
Do not read this as a league table of “easy” and “hard” industries. Agreement measures consensus, not opportunity. A low-agreement sector may offer more openings for a credible challenger, but it also requires more platforms, prompts and repeat runs before a result becomes stable.
What the traffic benchmark adds
Recommendation visibility matters even when it produces no click, but referral traffic reveals whether AI discovery is already sending measurable visits. Semrush analyzed worldwide mobile and desktop activity across more than 50,000 websites and 17 industries from January through December 2025. It defined AI traffic as referrals from conversational tools such as ChatGPT, Perplexity and Copilot, while tracking Google AI Mode separately.
Across that dataset, AI traffic rose from 462 million to 767 million monthly visits, a 66% increase. Yet its share of all visits was only 0.14%, compared with 16.04% for organic search. This gap explains why an industry can have meaningful AI recommendation activity while analytics still show few AI sessions. Mentions, citations and traffic belong on the same report, but they should remain separate metrics.
Why industry benchmarks move so quickly
AI answers are generated in a changing retrieval environment. SearchIntel’s three-week tracker found that seven of the top ten recommended brands remained in place for travel and wealth management, but only two remained for cyber security. A monthly snapshot may be adequate for a stable vertical; it can hide meaningful churn in a volatile one.
Platforms also build answers differently. SearchIntel found that Google AI Mode named only 3.5 brands per answer on average while using 21.8 citations. Claude named 6.2 brands with 7.0 citations, and ChatGPT named 4.6 brands with 4.0 citations. A page that contributes supporting evidence can therefore matter even when the brand is not placed in the final shortlist.
Failure patterns that cluster by industry
- Fast product cycles: consumer technology, fashion and retail can change faster than a quarterly prompt set.
- Local variation: travel, finance and home services need market, language and location controls.
- Trust-sensitive topics: health and finance require stronger source quality, clear authorship and careful claim boundaries.
- Inventory dependence: retail recommendations can become stale when price or availability changes.
- Third-party evidence gaps: a technically healthy brand site may still lack independent reviews, comparisons or editorial mentions.
- Measurement mismatch: teams often compare referral visits with competitor mention rates even though the denominators are unrelated.
A reproducible benchmark method for your website
Start with the AI Visibility Audit and Measurement Framework, then record each run using the monthly AI visibility report template. Keep the prompt set fixed long enough to detect change, and create a separate segment for experiments instead of silently replacing baseline prompts.
- Define the market. Record country, language, device context and whether location is embedded in the prompt.
- Choose representative prompts. Include discovery, comparison, problem-solving and branded verification questions.
- Run the same prompts on each platform. Save the answer, date, model or product surface, links and any personalization state.
- Normalize brand names. Merge spelling variations without merging genuinely different companies or products.
- Score separate events. A recommendation, unlinked mention, citation and referral visit are not interchangeable.
- Repeat the collection. Weekly runs suit volatile categories; monthly runs may suit more stable ones.
- Publish limitations. State missing answers, blocked runs, regional constraints and sample size beside the result.
Metrics to include in an AI visibility report
| Metric | Simple definition | Recommended denominator |
|---|---|---|
| Mention rate | Answers that name the brand | All valid answers for the brand’s prompt set |
| Recommendation rate | Answers that explicitly recommend the brand | All valid buying or comparison answers |
| Citation rate | Answers linking to the brand’s domain | All valid answers |
| Citation share | Brand-domain citations as a share of tracked citations | All citations in the same prompt and platform segment |
| Platform reach | Number of platforms naming the brand | Platforms successfully tested |
| Top-list stability | Names retained between measurement periods | Prior period’s top list |
| AI referral sessions | Visits attributed to AI sources | All sessions, reported separately by analytics tool |
Use denominators beside every percentage. “Mentioned in 40% of answers” is incomplete unless the reader can see whether that means 4 of 10 or 400 of 1,000, which platforms were tested and when the collection occurred.
Implications for website owners and practitioners
For B2B SaaS, higher cross-platform agreement suggests that established review and comparison ecosystems influence a shared shortlist. A challenger should audit not only its own pages but also category pages, credible reviews and product comparisons that AI systems may retrieve. Consumer-tech teams need a faster cadence because product evidence and recommendations change quickly.
Health, finance and other trust-sensitive sectors should prioritize factual accuracy, visible sourcing, author identity and update dates. Retail and travel teams should segment by geography and availability. Across every industry, the correct goal is not to imitate the benchmark average. It is to learn where your brand is absent, identify the missing evidence and verify whether a targeted change improves the same controlled prompt set.
Reproducibility and update policy
A credible AI search visibility benchmark by industry should preserve its prompt library, platform list, regional settings, collection dates, normalization rules and raw response records. When a platform changes or a prompt is retired, document the break in the series. Never backfill an old period with a new method and present the result as a continuous trend.
Visible Pilot will treat published benchmark editions as dated snapshots. Future first-party editions should disclose the sample, show absolute counts beside percentages, release field definitions and keep a change log so readers can compare periods without guessing what changed.
Frequently asked questions
What is a good AI search visibility score for my industry?
There is no universal good score. Use a peer set measured with the same prompts, platforms, region and collection window. Compare mention, recommendation and citation rates separately rather than collapsing them into one unexplained number.
Why is B2B SaaS agreement higher than consumer tech?
SearchIntel attributes the stronger B2B SaaS consensus partly to mature categories and extensive review-site coverage. Consumer technology changes faster and has more fragmented product evidence. This explains the sample; it does not prove the same gap will appear in every country or prompt set.
How often should AI visibility be measured?
Weekly measurement is appropriate for volatile sectors, launches or active experiments. Monthly reporting may be enough for steadier categories. Use the same collection method and label any platform failures so a missing answer does not look like a visibility loss.
Does more AI referral traffic mean better AI visibility?
Not necessarily. A brand may be mentioned or cited without receiving a click, and analytics tools may classify some visits differently. Track referral sessions as an outcome metric alongside answer-level visibility, not as a substitute for it.
Sources and research notes
- SearchIntel, 2026 AI Search Visibility Benchmarks, Edition 1 — 100 neutral UK questions, six platforms, ten verticals, plus a three-week tracker.
- Semrush, How AI Is Reshaping Traffic Channels — more than 50,000 websites across 17 industries during 2025.
- Semrush, AI Overviews’ Impact on Search in 2025 — 10M+ keywords and industry-specific AI Overview analysis.
- Ahrefs Q1 2026 AI Search Benchmark announcement — 13 studies using multiple large datasets and original experiments.
Build a benchmark you can defend. Audit your access, visibility, citations and referral evidence separately, then compare the same measurements over time. Start with the Visible Pilot AI visibility audit framework.