

A monthly AI visibility report template turns unstable AI-search observations into a consistent decision record. Instead of collecting a few favorable screenshots, it tracks the same prompts, platforms, brand mentions, citations, competitors, sentiment, and source pages every month. The result is a report that shows what changed, what stayed uncertain, and which website action deserves attention next.
Template outcome: use the structure below to build a repeatable monthly report for a brand, client, or agency portfolio. It separates observable results from assumptions and keeps every percentage tied to a visible denominator.
What is included in the monthly AI visibility report template
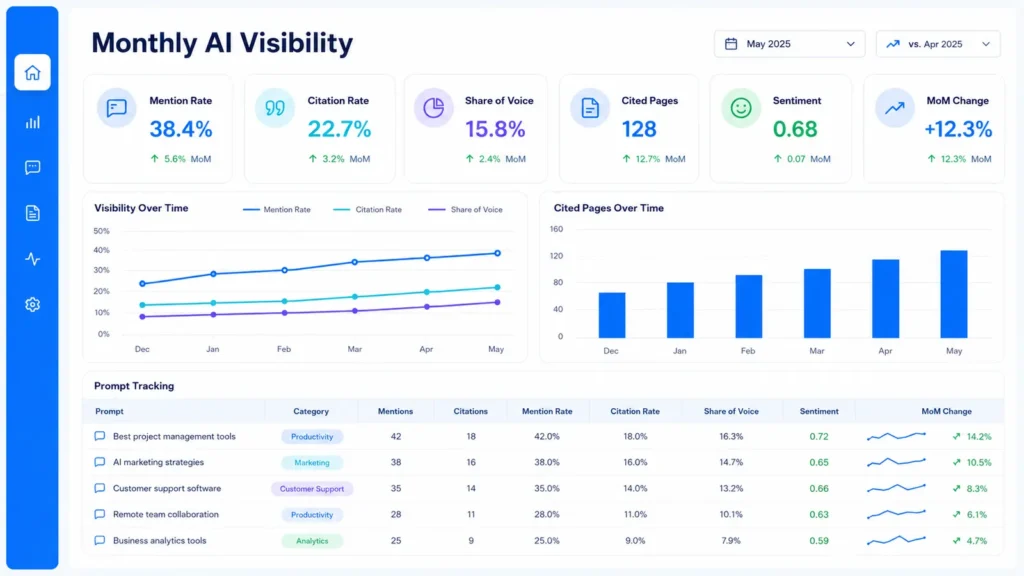
The template has four working layers. The first is a setup sheet containing the brand dictionary, competitors, target market, platforms, prompt panel, and matching rules. The second is an evidence log with one row per prompt and platform run. The third calculates transparent monthly metrics. The fourth is an executive summary that converts changes into prioritized actions.
- Report setup: brand names and aliases, owned domains, competitors, language, country, audience, platforms, test date, and report owner.
- Prompt panel: prompt ID, topic, funnel stage, exact wording, intent, target page, and whether the query is branded or non-branded.
- Observation log: complete response, brand mentioned, position, citation present, cited URL, source owner, competitor mentions, sentiment, factual accuracy, and screenshot or evidence link.
- Metrics: mention rate, owned-domain citation rate, citation-to-mention rate, competitor share, positive or neutral context, repeat rate, and month-over-month movement.
- Action tracker: finding, supporting evidence, affected page, owner, priority, proposed change, due date, and retest status.
Do not create one mysterious “AI score.” A brand can be mentioned without a citation, cited without receiving a click, or visible on one platform but absent on another. Separate metrics preserve the diagnosis.
Field guide: define every input, metric, and status label
| Field | Definition | Recommended format |
|---|---|---|
| Prompt ID | Stable identifier that never changes when results are updated | P001, P002, P003 |
| Platform | Product and experience tested; record the model or mode when visible | Platform name + mode |
| Run date | Local date and time of the observation | YYYY-MM-DD HH:MM |
| Brand mention | Accepted brand or product name appears in the answer | Yes / No / Ambiguous |
| Owned citation | Visible source points to an approved owned domain | Yes / No / Unavailable |
| Cited URL | Exact destination shown by the platform | Canonical URL |
| Context | How the brand is framed in the answer | Positive / Neutral / Negative / Incorrect |
| Repeat status | Whether the result reappeared in the defined retest | Repeated / Changed / Not retested |
| Evidence | Saved answer, source list, or screenshot reference | Link or file ID |
| Action | Smallest evidence-backed next step | Owner + due date |
Mention rate equals prompts where the accepted brand appears divided by eligible prompts tested. Owned-domain citation rate equals prompts with at least one visible citation to an approved domain divided by eligible prompts tested. Citation-to-mention rate divides owned citations by prompts containing the brand. Display both the numerator and denominator—for example, 9 of 30, not only 30%.
Share of voice needs an equally explicit rule. A simple version divides your brand mentions by total tracked-brand mentions across the same prompt panel. If a single response names three companies, count according to a documented method and use it every month. Never compare a 20-prompt test in one month with an unadjusted 50-prompt test in the next.
Setup instructions: choose prompts, establish a baseline, and set cadence
- Choose one business question for the report: category discovery, product consideration, local recommendations, or another clearly bounded journey.
- Create 15 to 30 non-branded prompts covering discovery, comparison, problem solving, and purchase intent. Add a small branded set for factual-accuracy checks, but report it separately.
- Freeze the wording and assign stable IDs. If a prompt must change, retire the old ID and create a new one rather than silently editing history.
- Record the platforms, market, language, account state, location settings, and visible model or search mode. These conditions can affect results.
- Run a baseline across the entire panel, preserve the answer and sources, and review ambiguous matches manually.
- Choose a regular collection window, such as the first three working days of each month. Avoid comparing measurements taken around unrelated campaign spikes unless the context is recorded.
- Assign one owner to quality-check denominators, duplicates, missing runs, URLs, and action statuses before the report is shared.
Recommended cadence: a monthly fixed-panel check is practical for operational reporting, while a deeper quarterly review can refresh competitors, prompts, target pages, and business assumptions. Do not change the panel merely to improve the chart.
Example: one completed monthly report row
The example below is fictional and demonstrates the template rather than a Visible Pilot customer result. Imagine a project-management SaaS tracking the neutral prompt “best project management software for small agencies” on one AI search experience.
| Field | Illustrative value |
|---|---|
| Prompt ID | P014 |
| Prompt | Best project management software for small agencies |
| Platform and mode | Example AI search mode |
| Test date | 2026-08-03 |
| Brand mentioned | Yes, position 3 in the answer |
| Owned-domain citation | Yes |
| Cited URL | /project-management-for-agencies/ |
| Competitors mentioned | Three tracked alternatives |
| Context | Positive and factually accurate |
| Repeat status | Repeated in 2 of 3 controlled runs |
| Recommended action | Expand agency workflow examples on the cited page |
If the monthly panel contained 30 eligible prompts and the brand appeared in 9, the mention rate would be 9 ÷ 30 = 30%. If the owned domain was cited in 6 prompts, the citation rate would be 6 ÷ 30 = 20%. Reporting “9 of 30” and “6 of 30” makes the sample size visible and prevents a polished percentage from hiding thin evidence.
Reporting workflow: turn observations into decisions
- Collect: run the frozen prompt panel within the scheduled window and preserve complete answers and sources.
- Validate: check brand aliases, ambiguous matches, redirects, source ownership, factual errors, and missing runs.
- Calculate: update metrics using eligible rows only and show exclusions in a separate count.
- Compare: contrast the current month with the same prompt IDs, platforms, and conditions from the previous month.
- Act: select no more than three prioritized actions, assign owners, and define the evidence required for a successful retest.
Decision rule: investigate a change before celebrating or escalating it. A different platform mode, altered prompt set, missing runs, product update, regional setting, or temporary answer variation can move the metric without any website change.
What the executive summary should show

The summary should fit on one screen. Lead with the reporting period, number of eligible prompts, platforms tested, and data completeness. Then show current and previous mention rate, citation rate, competitor share, sentiment or accuracy status, and the most frequently cited owned pages. Place a short evidence note beside every material movement.
Follow the metrics with three sections: wins supported by evidence, risks requiring diagnosis, and actions for the next month. A good action is specific—“add a comparison table and primary-source references to the agency workflow page”—not a vague instruction such as “improve GEO.” Include an owner, deadline, affected URL, and retest prompt IDs.
Avoid inconsistent samples, duplicate prompts, and misleading averages
- Do not merge branded and non-branded prompts into one discovery rate.
- Do not count the same prompt twice because it appears in two categories; give it one stable ID.
- Do not treat a brand mention and an owned-domain citation as the same event.
- Do not average platform percentages when platforms have different sample sizes. Calculate from the underlying counts or report platforms separately.
- Do not score an unavailable source list as “no citation.” Use an unavailable status.
- Do not keep only favorable runs. Apply the same repeat rule to every prompt.
- Do not compare months until exclusions, failed runs, and prompt-panel changes are disclosed.
- Do not infer causation from timing alone. Record website changes, but require a controlled retest before attributing movement.
Versioning and monthly or quarterly comparison method
Name each raw evidence tab or export with the period and version, such as 2026-08_v1. Lock the finalized monthly dataset and make corrections in a new version with a change note. Keep a prompt register showing created, revised, retired, and replacement IDs. This prevents historical numbers from changing silently when the team cleans the workbook.
For month-over-month comparison, include only prompt-platform pairs present in both periods, then show new and retired rows separately. For quarterly reporting, retain the fixed-panel trend and add a clearly labeled expanded diagnostic sample if needed. A clean comparison set gives management a trend; the expanded set gives practitioners new clues without corrupting the baseline.
Quality check before sharing: confirm that totals reconcile with row-level evidence, every percentage shows its denominator, cited URLs open, exclusions are counted, illustrative examples are labeled, and the action list is connected to specific findings.
How to use the report with an AI visibility audit
A report measures repeated outcomes; an audit explains why those outcomes may be weak. If mentions fall, inspect discovery, crawler access, rendering, index controls, entity clarity, content fit, authority, and source quality before publishing more pages. Visible Pilot’s AI Visibility Audit and Measurement Framework provides the broader diagnostic structure.
If the numbers from two products disagree, read why AI visibility scores differ between tools. Different prompt libraries, platforms, regions, sampling windows, matching rules, and scoring formulas often explain the gap. The monthly template makes those inputs visible so a team can compare methods instead of arguing about vendor dashboards.
Frequently asked questions
Can I use the template in Excel or Google Sheets?
Yes. The structure uses ordinary rows, columns, filters, formulas, and links. Keep raw observations separate from calculations and the executive summary. If several people edit the file, protect formula cells and require a note when scoring rules change.
How many prompts should a monthly AI visibility report track?
Start with a focused panel of 15 to 30 prompts per market and audience. A smaller relevant set that can be repeated reliably is more useful than hundreds of loosely related questions. Expand only when the business needs another category, funnel stage, location, or language.
Which AI visibility metrics matter most?
Mention rate, owned-domain citation rate, competitor share, factual accuracy, context, cited pages, and repeat rate form a practical core. Referral visits and conversions are important downstream measures, but they should remain separate because not every mention produces a visible link or click.
Should every platform be combined into one score?
Usually no. Platform behavior, source presentation, availability, and samples differ. Report each platform separately first. If leadership needs a portfolio view, show transparent underlying counts and explain any weighting instead of presenting an unexplained composite.
How often should the prompt set change?
Keep the core set stable long enough to observe trends. Review it quarterly or after a meaningful product, audience, market, or search-experience change. Retire obsolete prompts with an effective date and preserve their historical rows rather than rewriting past reports.
Download and use the monthly AI visibility report template
Use the tables and field definitions in this guide to create your first monthly AI visibility report template. Visible Pilot is preparing a downloadable version with an evidence log, formulas, dashboard, version register, and action tracker. Request early access to the template and use the same fixed-panel method for your next reporting cycle.